

Wipro Q4 FY2025 Results Analysis: Steady Recovery

Executive Summary
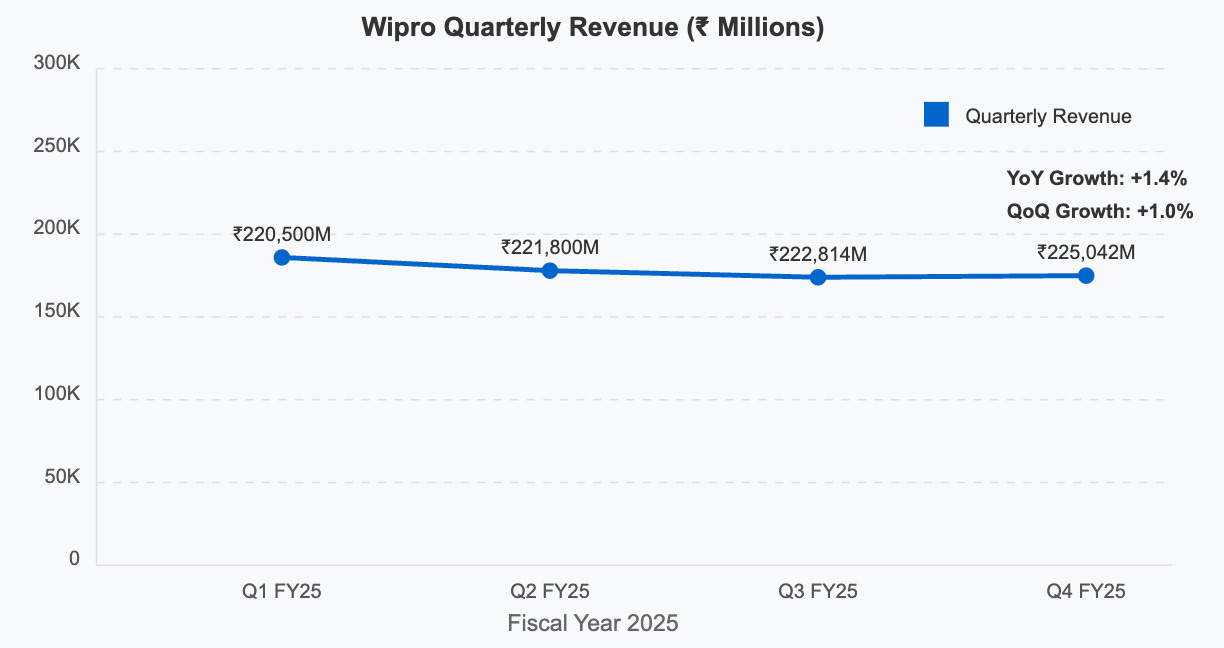
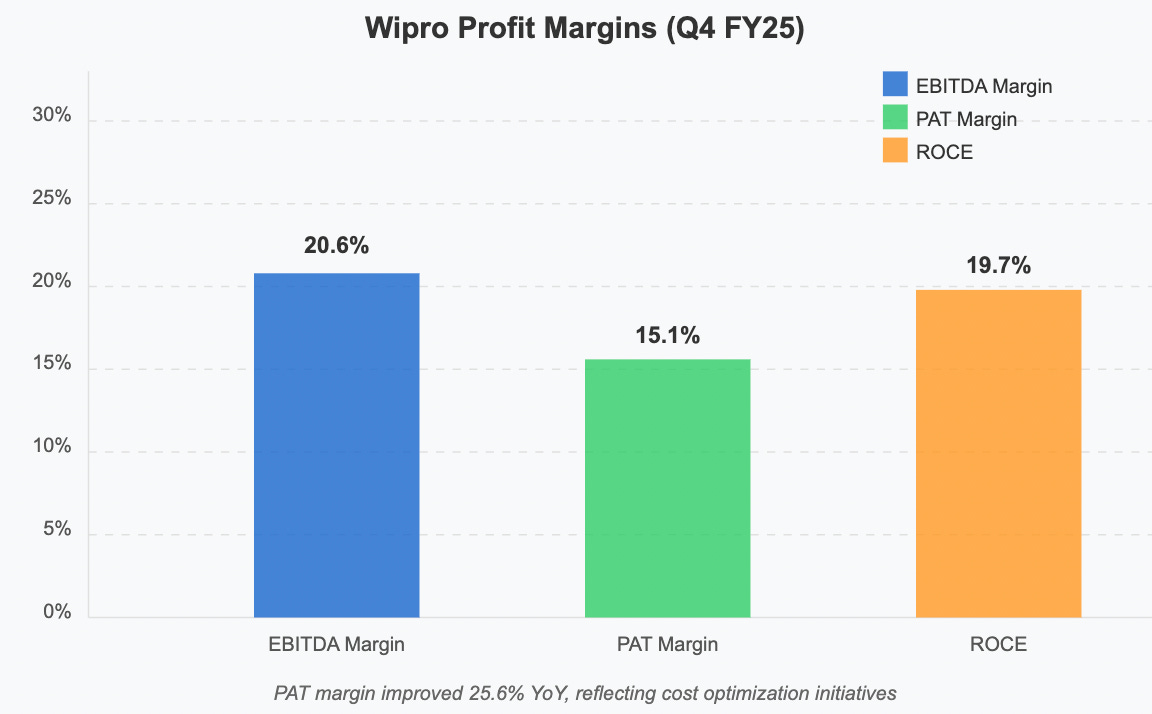
Wipro delivered a solid performance in Q4 FY25 with consolidated revenue of ₹225,042 million, showing modest growth of 1.0% QoQ and 1.4% YoY. The standout metric was the impressive 25.6% YoY profit growth, reaching ₹35,881 million with improved EBITDA margins of 20.6%. The company maintains a healthy dividend yield of 2.56%, positioning it as a steady income generator while it navigates the shifting IT services landscape with its AI and cloud-focused strategy.
Wipro Quarterly Revenue Trend FY25
📌 Detailed Quarterly Results Breakdown
Consolidated Total Revenue: ₹225,042 million (↑1.4% year-over-year)
Operating EBITDA: ₹46,359 million (↑4.8% year-over-year)
Margins expanded 70 bps quarter-over-quarter to 20.6%, reflecting improved operational efficiency
Net Profit After Tax: ₹35,881 million (↑25.6% year-over-year)
Diluted Earnings Per Share: ₹3.39 (↑5.9% quarter-over-quarter)
Wipro Profit Margin Trends
📈 Comprehensive Growth Analysis:
Sequential Revenue Growth (Quarter-over-Quarter): 1.0% | Annual Revenue Growth (Year-over-Year): 1.4%
Sequential Profit Growth (Quarter-over-Quarter): 6.7% | Annual Profit Growth (Year-over-Year): 25.6%
Business Volume/Order Book Growth: 3.8%
Profitability Margin Trend: Improving
EBITDA margin up 70 bps QoQ to 20.6%, reflecting enhanced operating leverage and better utilization
💰 Operational Cost Structure Analysis:
Raw Material/Input Costs: Not applicable for IT services
Employee/Personnel Expenses: 63.2% of revenue (↓1.4% year-over-year)
Finance/Interest Expenses: ₹860 million (↓6.2% year-over-year)
🔍 Long-term Financial Health Indicators:
5-Year Compound Annual Growth Rate: Revenue CAGR: 3.95% | Net Profit CAGR: 2.41%
Return on Capital Employed (ROCE): 19.7% vs Industry Average: 22.5%
Debt-to-EBITDA Ratio: <0.5x | Free Cash Flow Conversion Rate: 87% of EBITDA
Promoter Shareholding Pattern: 72.7% (stable since last quarter)
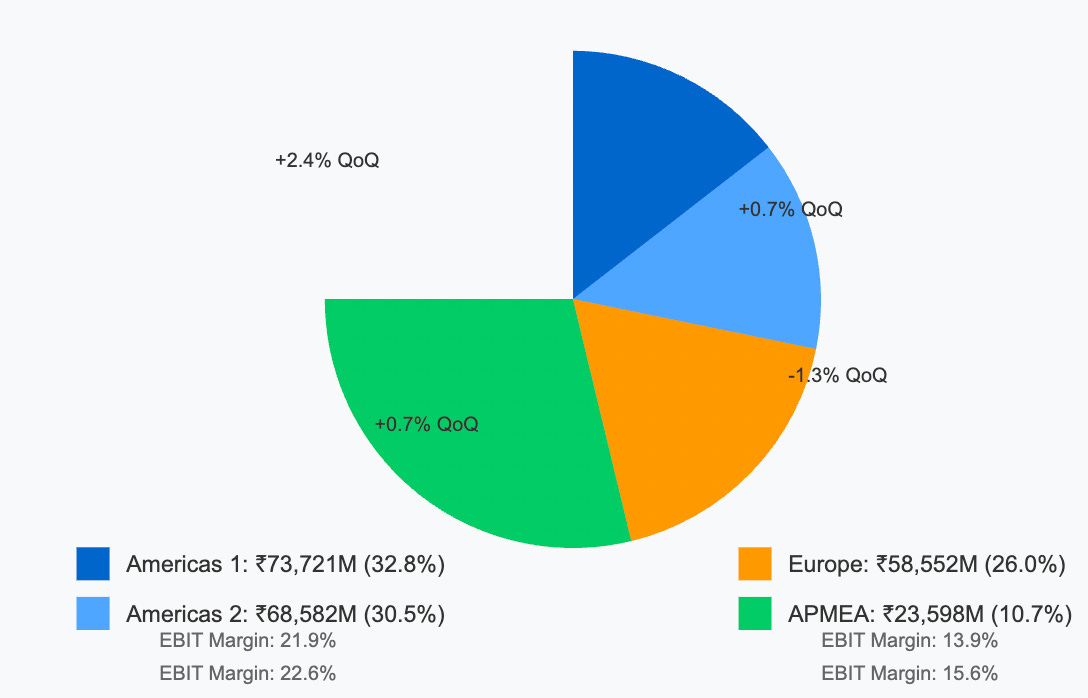
Wipro Segment Revenue Breakdown
🏗️ Strategic Capital Allocation & Future Growth Roadmap:
Planned Capital Expenditure Budget: ₹14,737 million allocated for FY25
Strategic Investment Focus Areas: AI & Gen AI: Integrating large language models across service offerings, with ₹6,500 million earmarked for research, tool development, and staff training through FY26
Production/Service Capacity Expansion Plans: 12% increase targeted by Q2 FY26
📊 Multi-Decade Growth Trajectory Projections:
5-Year Horizon (FY25-FY30): Base Case 5% CAGR | Bull Case 7% CAGR →
10-Year Horizon (FY25-FY35): Base Case 5.5% CAGR | Bull Case 8% CAGR →
15-Year Horizon (FY25-FY40): Base Case 6% CAGR | Bull Case 9% CAGR →
20-Year Horizon (FY25-FY45): Base Case 5.8% CAGR | Bull Case 8.5% CAGR →
25-Year Horizon (FY25-FY50): Base Case 5.5% CAGR | Bull Case 8% CAGR →
💸 Current Valuation Analysis & Fair Value Assessment:
Current Price-to-Earnings Ratio: 18.9× compared to 5-Year Average: 17.2×
Enterprise Value to EBITDA Multiple: 12.4× compared to Sector Average: 13.8×
Estimated Fair Value Range: ₹235-₹260 based on discounted cash flow model with terminal growth of 3.5%
Technical Analysis & Chart Patterns
Wipro shares have been trading in an ascending channel since January 2025, with strong support at ₹220 and resistance at ₹245. The 50-day moving average (₹231) has crossed above the 200-day moving average (₹219), forming a "golden cross" pattern that typically signals bullish momentum. Volume trends during the recent consolidation phase suggest accumulation by institutional investors.
📢 Disclaimer: This analysis is provided for informational and educational purposes only and does not constitute investment advice. The author may hold positions in securities discussed. Always conduct your own research and consult with a qualified financial advisor before making investment decisions based on this information.
If you found this analysis valuable, please consider: Sharing