

ValuePicks Studies - India Market Macro Report: April 8, 2026 | Economic Outlook & Trends
🌍 Macro Context: Strait of Hormuz Shock — Week 6

Markets, Macro & Geopolitics
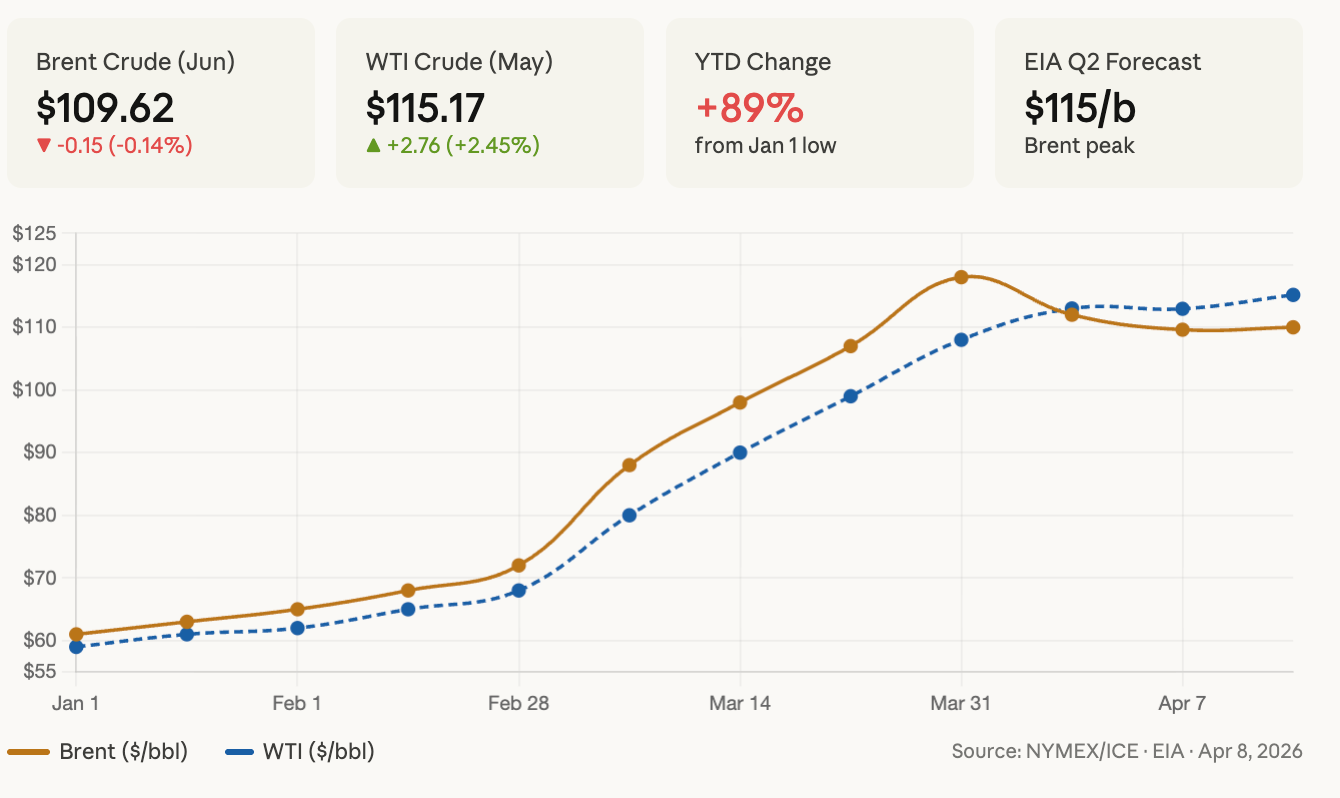
The defining macro narrative of Q1 2026 remains the Middle East energy crisis. Brent crude began 2026 at $61/b and finished Q1 at $118/b — the largest inflation-adjusted quarterly price increase since 1988 — following US-Israeli military action on February 28 and the subsequent de facto closure of the Strait of Hormuz. US crude oil for May settled near $112.95/barrel, while Brent (June delivery) hovered around $109.62/barrel as markets parsed Trump’s overnight ultimatum threatening to “decimate Iran’s power plants and bridges” if the Strait remained closed by Tuesday’s 8 p.m. ET deadline.
The EIA estimates that Iraq, Saudi Arabia, Kuwait, UAE, Qatar, and Bahrain collectively shut in 9.1 million barrels per day of crude production in April, with the agency forecasting Brent to peak at $115/b in Q2 2026 before supply disruptions gradually abate.
Screenshot 2026-04-08 at 7.14.42 AM.png
📈 Bond Markets — Yields Under Pressure
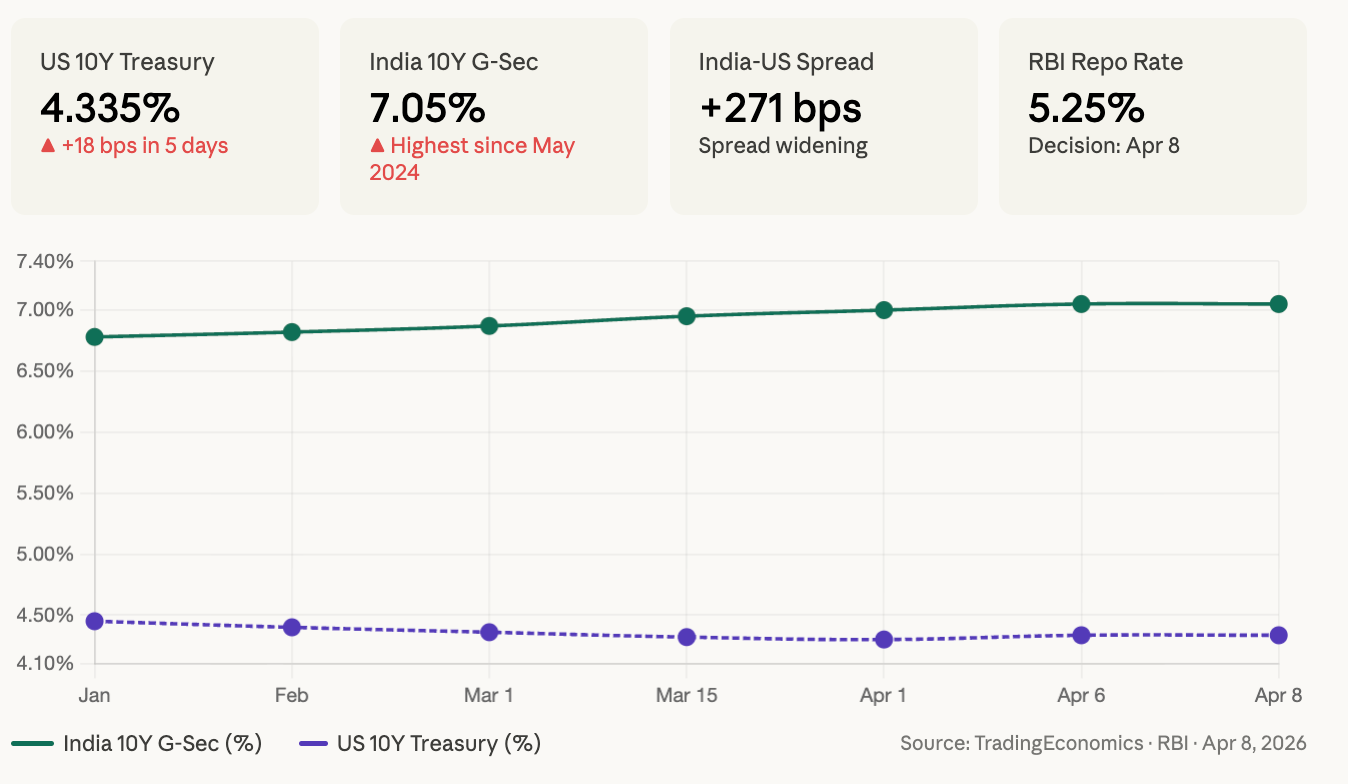
The US 10-year Treasury yield edged down to 4.31%–4.33% on Thursday after rising to as high as 4.38% earlier in the session, as reports of Iran drafting a protocol with Oman to monitor Strait traffic offered some relief. India’s 10-year G-Sec climbed to 7.10%, its highest level since May 2024, as surging crude costs heightened inflation expectations and intensified concerns over potential rate hikes by the RBI. Market participants noted that oil above $100/bbl could push CPI inflation past 6%. The RBI’s April 8 policy meeting is being closely watched, with expectations split between a hold at 5.25% and a hawkish pivot
😰 Fear Gauge — VIX & India VIX
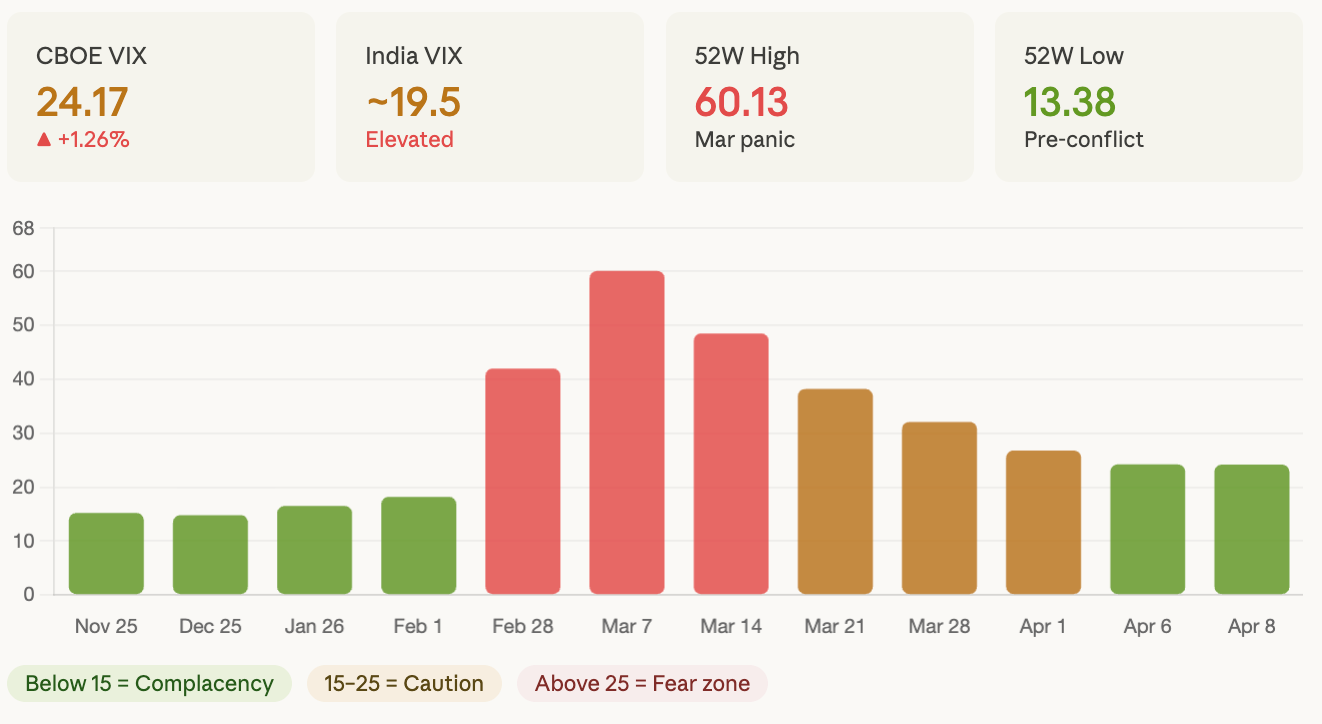
The CBOE VIX closed at 24.17, up 1.26% on April 6, with the S&P 500 futures pointing to further softness in pre-market trading. The VIX’s 52-week range spans 13.38 to 60.13, with the index touching 60+ during the peak geopolitical panic in late February/March, before retreating as diplomatic signals emerged. India VIX (India fear index) is running elevated at ~18–20, per NSE intraday commentary, keeping domestic bulls cautious.
🇮🇳 Nifty 50 — Key Levels & Fibonacci Analysis
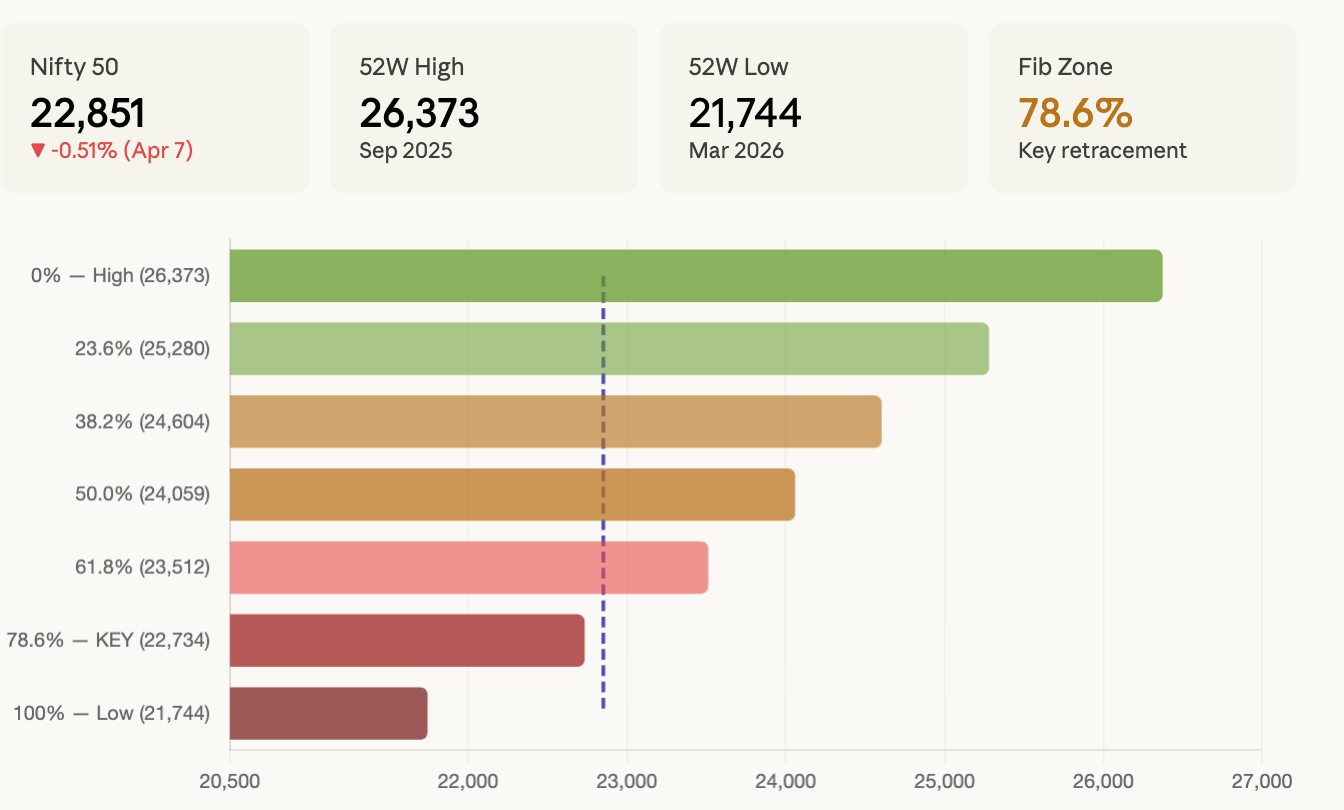
The Nifty 50 closed at 22,968.25 on April 6, up 1.12%, led by Trent (+8%) on strong Q4 revenue and broad banking participation. On April 7, it opened at 22,838 and was trading down ~0.51% around 22,851. The index is in a wait-and-watch mode ahead of the Trump-Iran deadline resolution and the RBI policy outcome. The 22,900–23,000 zone is the critical resistance area, while 22,600–22,500 is the immediate support zone. A definitive break below 22,500 could drag the index toward 22,300, with a deeper demand zone at 21,700.
Nifty 50 Fibonacci Summary Table
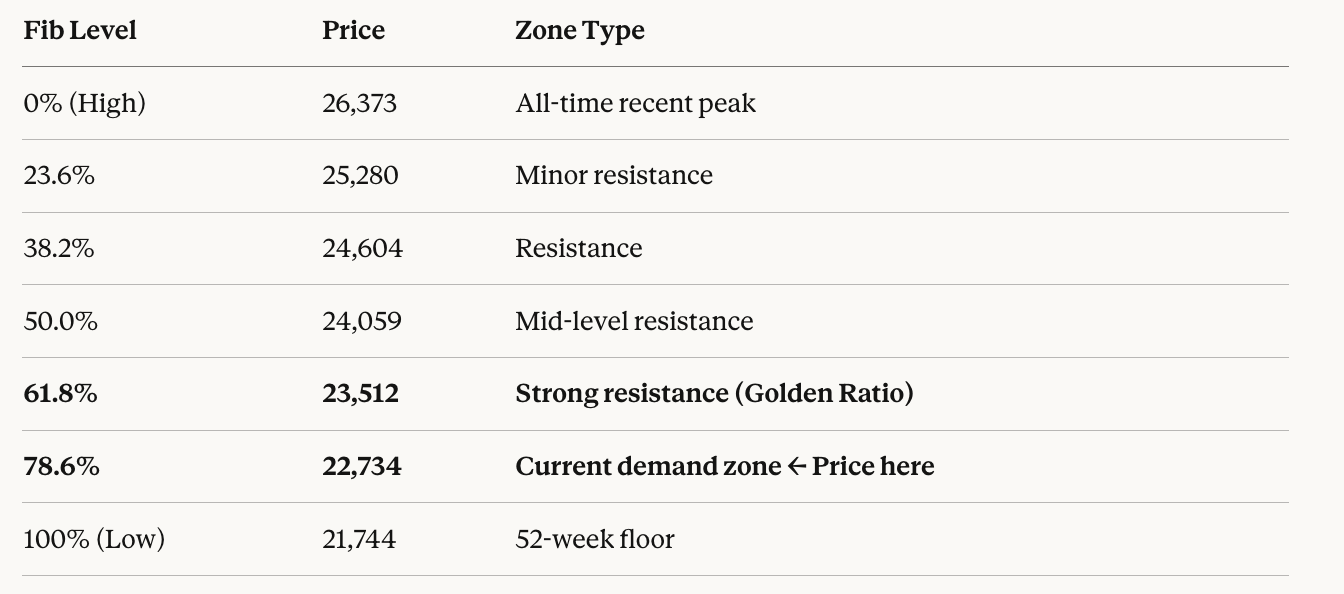
:
Fib Level Price Zone Type 0% (High) 26,373 All-time recent peak 23.6% 25,280 Minor resistance 38.2% 24,604 Resistance 50.0% 24,059 Mid-level resistance 61.8% 23,512 Strong resistance (Golden Ratio) 78.6% 22,734 Current demand zone ← Price here 100% (Low) 21,744 52-week floor
🔵 Current price ~22,851 holds above the 78.6% retracement (22,734). A sustained reclaim of 23,512 (61.8%) would mark a meaningful recovery.
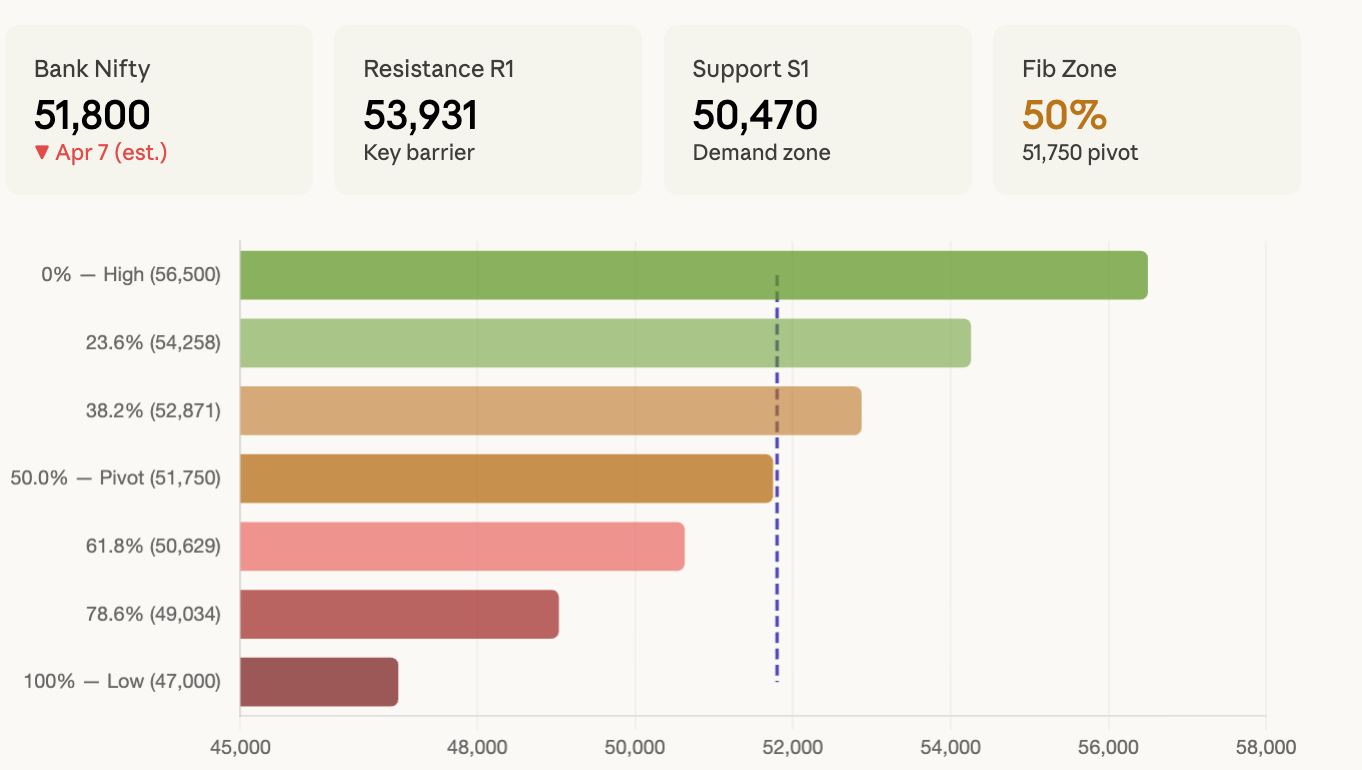
🏦 Bank Nifty — Fibonacci & Key Levels
Bank Nifty opened at ~52,621 on April 7 and slipped toward 51,800, forming lower lows and indicating continued structural weakness. A breakdown below 51,700 could push the index toward 51,000–50,650, while the 52,200–52,300 zone is immediate resistance. Bank Nifty near-term support sits at 51,288/50,470 and resistance at 53,931/54,748
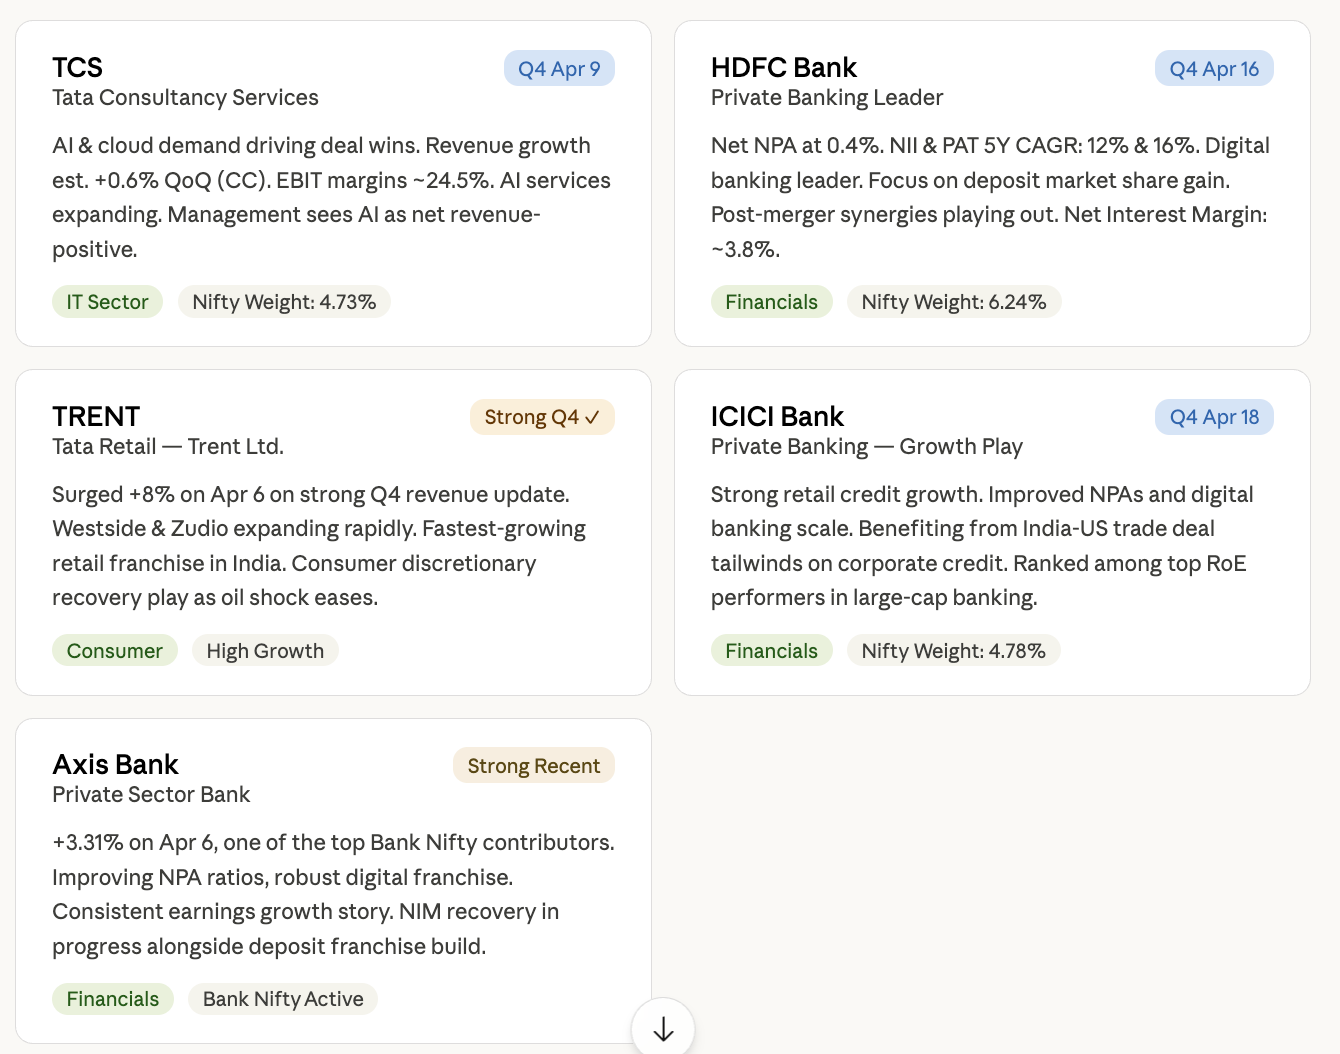
🔥 Top 5 Stocks — Future Earnings & Growth Watch
Based on upcoming results, fundamental strength, and recent price action
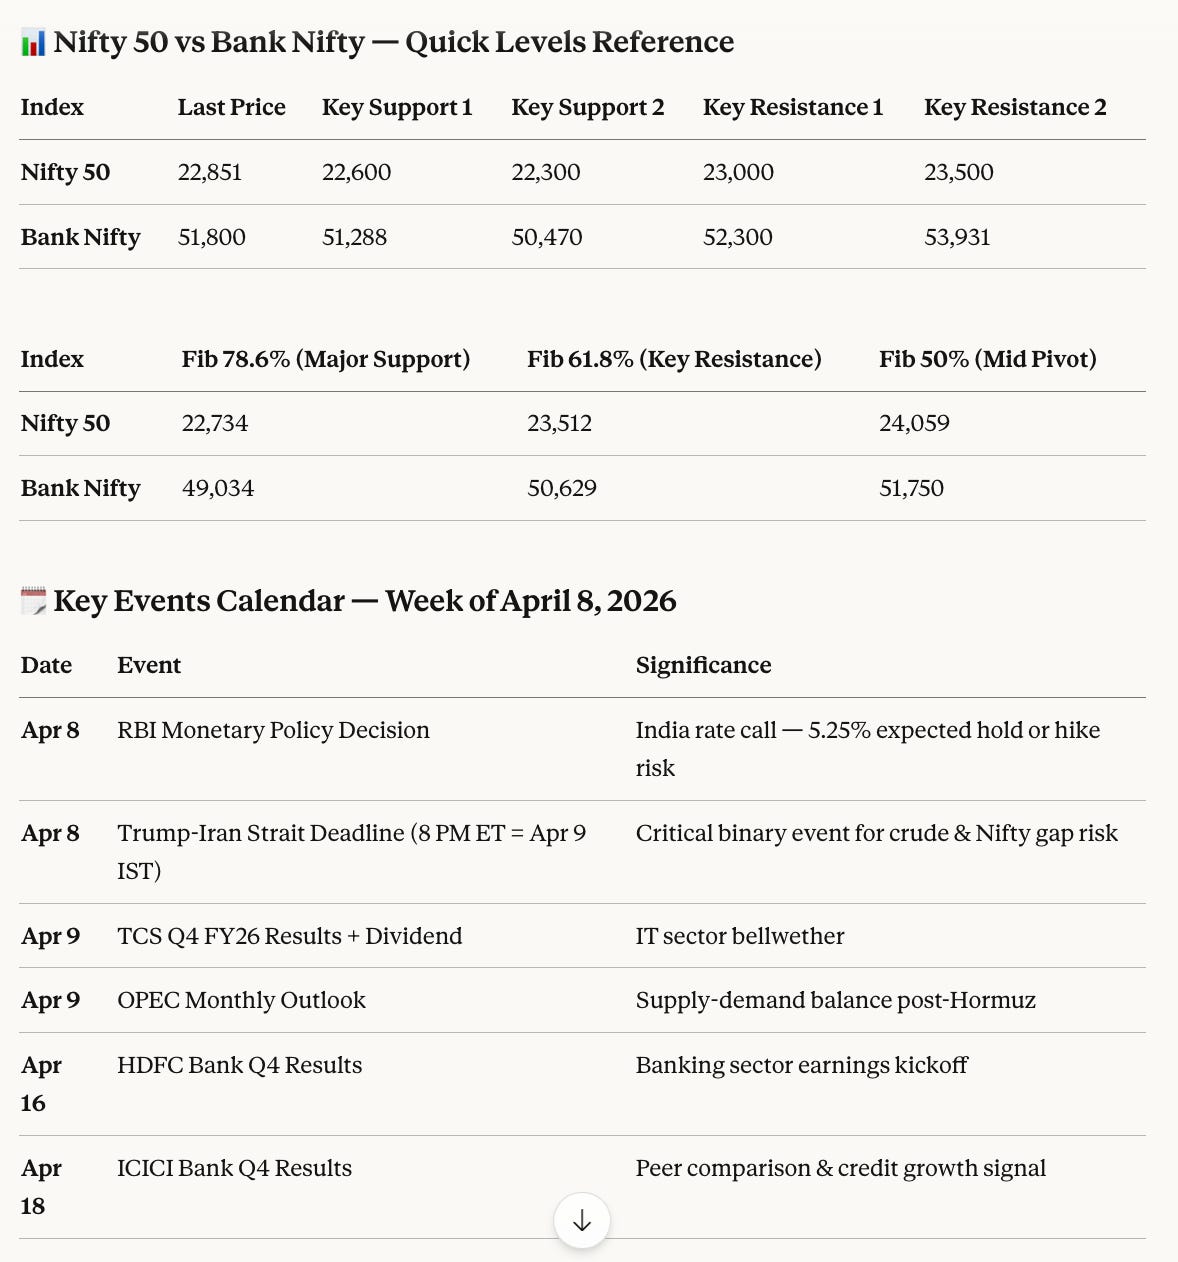
📊 Nifty 50 vs Bank Nifty — Quick Levels Reference
🧭 Macro Synthesis — What It All Means
Crude at $110–115 is the dominant macro variable. It creates a triple whammy for India: higher import bill, rupee pressure (USD/INR above record highs), and inflation risk pulling the RBI away from accommodation. Traders note that oil above $100/bbl could push CPI past 6%, while expectations of further rate increases have already been partially priced into yields, reflecting persistent geopolitical risks.
VIX at 24 signals the market is cautious but not in full panic (the March panic peak was 60). This level historically corresponds to high intraday swings, premium richness in options, and choppy two-way price action in equities.
Nifty 50 at ~22,850 is clinging to the 78.6% Fibonacci retracement zone. The market is in wait-and-watch mode, reacting to every headline ahead of the Trump-Iran deadline falling early morning IST on April 8. A resolution of the Hormuz standoff could trigger a sharp relief rally toward the 23,500–23,700 zone. A breakdown below 22,500 opens the path toward 21,700.
Bond markets are pricing in a higher-for-longer world. The Fed is expected to keep rates unchanged for the year, and earlier rate cut hopes have faded as the energy crisis re-stokes inflation fears.
📌 Disclaimer: This report is compiled for educational and informational purposes only. It is not investment advice. All data sourced from publicly available sources — NYMEX/ICE, NSE, EIA, CBOE, TradingEconomics, CNBC — as of April 8, 2026. Fibonacci levels are technical analytical tools, not trade recommendations. Always consult a SEBI-registered financial advisor before making investment decisions.
— Macro Daily | April 8, 2026 | For Value Picks Studies Subscribers