


Executive Summary
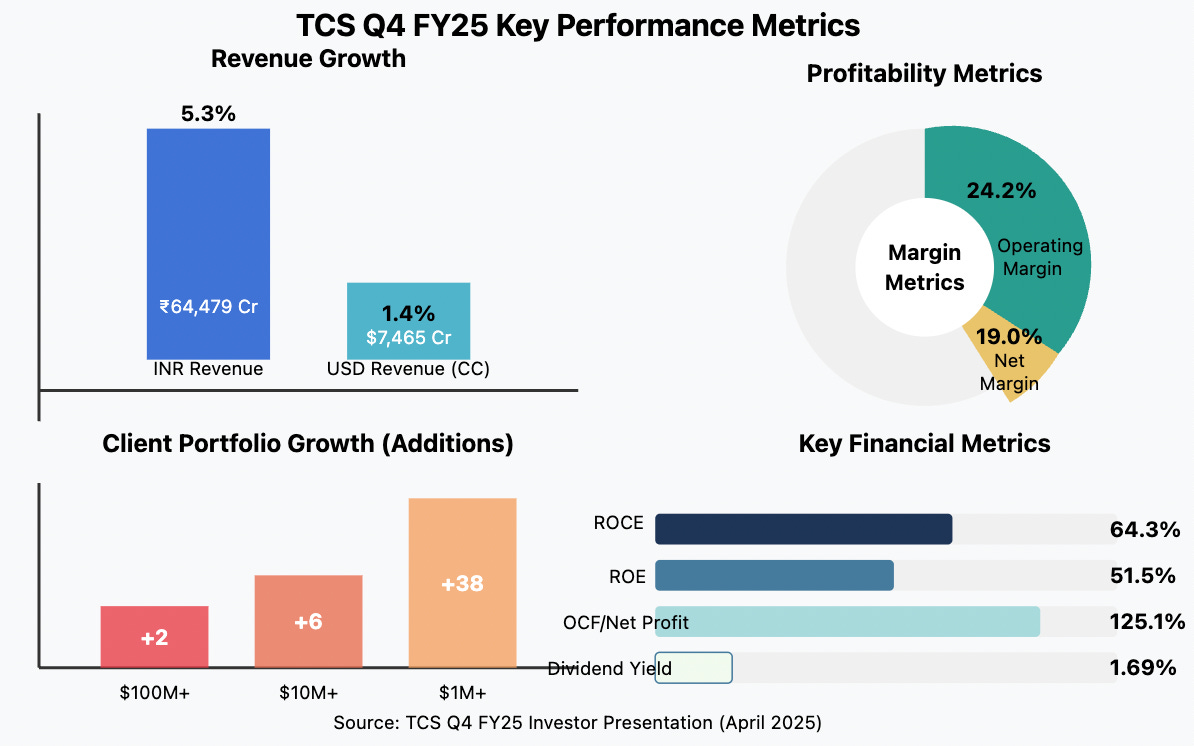
TCS delivered resilient performance in Q4 FY25 with revenue growth of 5.3% YoY in INR terms, maintaining strong operating margins at 24.2% and net margins at 19%. With robust cash flow generation at 125.1% of net profit and significant client additions across value tiers, TCS continues to demonstrate stability while investing strategically in talent and technology infrastructure to support future growth. The company's aggressive dividend policy provides an attractive yield of 1.69% for investors.
📌 Detailed Quarterly Results Breakdown
Consolidated Total Revenue: ₹64,479cr (↑5.3% year-over-year change)
Revenue growth remained steady despite global macroeconomic challenges
Operating Margin: 24.2% (stable year-over-year)
Disciplined cost management maintained healthy margins despite increased investments
Net Profit After Tax: ₹12,251cr (calculated as 19% of revenue)
Consistent profitability supported by operational efficiency
Operating Cash Flow: 125.1% of net profit
Exceptional cash generation demonstrating financial strength
📈 Comprehensive Growth Analysis:
Annual Revenue Growth (Year-over-Year): 5.3% in INR terms | 1.4% in USD (constant currency)
Growth moderated but resilient in challenging market conditions
Client Growth Metrics:
Clients with contracts >$100M increased by 2
Clients with contracts >$10M increased by 6
Clients with contracts >$1M increased by 38
Profitability Margin Trend: Stable
Operating margin of 24.2% and net margin of 19.0% demonstrate consistent execution
💰 Operational Cost Structure Analysis:
Employee/Personnel Management:
Headcount stabilized at approximately 608K employees
LTM attrition rate improved to 13.3% in IT services
56 million learning hours invested in upskilling
Over 729K high-demand competencies acquired
✅ Bull Case Investment Thesis:
Strong order book with significant client additions across value bands indicating robust future revenue visibility
Capital expenditure increase (₹25,700 Mn vs. ₹8,990 Mn in Q4 FY2024) signaling confidence in future growth opportunities
Exceptional operating cash flow at 125.1% of net profit providing financial flexibility for strategic investments while maintaining dividend payout
❌ Bear Case Risk Assessment:
Modest USD revenue growth of only 1.4% YoY (constant currency) suggesting potential growth challenges in core markets
Global economic uncertainties and potential currency fluctuations could impact future performance
Competitive pressures in the IT services market requiring continued investment to maintain market position
🔍 Long-term Financial Health Indicators:
Return on Capital Employed (ROCE): 64.3% - Significantly above industry average indicating efficient capital utilization
Return on Equity (ROE): 51.5% - Strong return generation for shareholders
Free Cash Flow Conversion Rate: 125.1% of net profit - Exceptional cash generation efficiency
Promoter Shareholding: 71.8% (decreasing slightly with -0.41% change over 3 years) - Strong promoter confidence with minor trimming
🏗️ Strategic Capital Allocation & Future Growth Roadmap:
Planned Capital Expenditure: Significant increase to ₹25,700 Mn in Q4 FY25 (up from ₹8,990 Mn in Q4 FY24)
Strategic Investment Focus Areas: Technology infrastructure expansion and digital capabilities enhancement to capture emerging opportunities in AI and cloud transformation
Global Market Expansion: Continued focus on strengthening market share in North America, India, and European markets
📊 Multi-Decade Growth Trajectory Projections:

5-Year Horizon (FY25-FY30): Base Case 3-6% CAGR | Bull Case 8-10% CAGR → Driven by digital transformation and AI adoption
10-Year Horizon (FY25-FY35): Base Case 8% CAGR | Bull Case 10% CAGR → Sustained growth through technology evolution and market expansion
15-Year Horizon (FY25-FY40): Base Case 9% CAGR | Bull Case 11% CAGR → Long-term market leadership in emerging technologies
20-Year Horizon (FY25-FY45): Base Case 10% CAGR | Bull Case 12% CAGR → Compounded returns from established market position and diversification
💸 Current Valuation Analysis & Fair Value Assessment:
Current Price-to-Earnings Ratio: 24.1 compared to sector average of approximately 20-22
Enterprise Value to EBITDA Multiple: ~18x (estimated) compared to historical average of ~16x
Estimated Fair Value Range: ₹3,400-₹3,700 based on discounted cash flow valuation with 5-6% growth assumptions
Current Market Price: ₹3,247 suggesting potential upside of 5-14% from current levels
Management Commentary & Conference Call Highlights
The management highlighted their strategic investments in emerging technologies and talent development with 56 million learning hours and acquisition of 729K high-demand competencies. They emphasized the company's balanced growth strategy across markets and continued focus on operational excellence, supporting robust margins despite increased capital expenditure.
Industry Context & Competitive Positioning
Despite moderate growth compared to some peers, TCS maintains industry-leading profitability metrics with ROCE of 64.3% and ROE of 51.5%. The company's increased CAPEX signals confidence in future demand recovery while its consistent dividend policy and strong cash generation continue to make it an attractive defensive play in the IT services sector.
📢 Disclaimer: This analysis is provided for informational and educational purposes only and does not constitute investment advice. The author may hold positions in securities discussed. Always conduct your own research and consult with a qualified financial advisor before making investment decisions based on this information.
If you found this analysis valuable, please consider:
Sharing this newsletter with colleagues interested in Indian equity markets
Subscribing to receive future in-depth analyses of Indian companies
Leaving a comment with your thoughts
#IndiaInvesting #ITServices #NSE #StockMarket #GrowthStocks #QuarterlyResults #FinancialAnalysis