

Engineering Services Giant Posts Mixed Q1 FY26 Results Amid Strategic Transformation

Premium Equity Research | August 2025
📊 ## Executive Summary
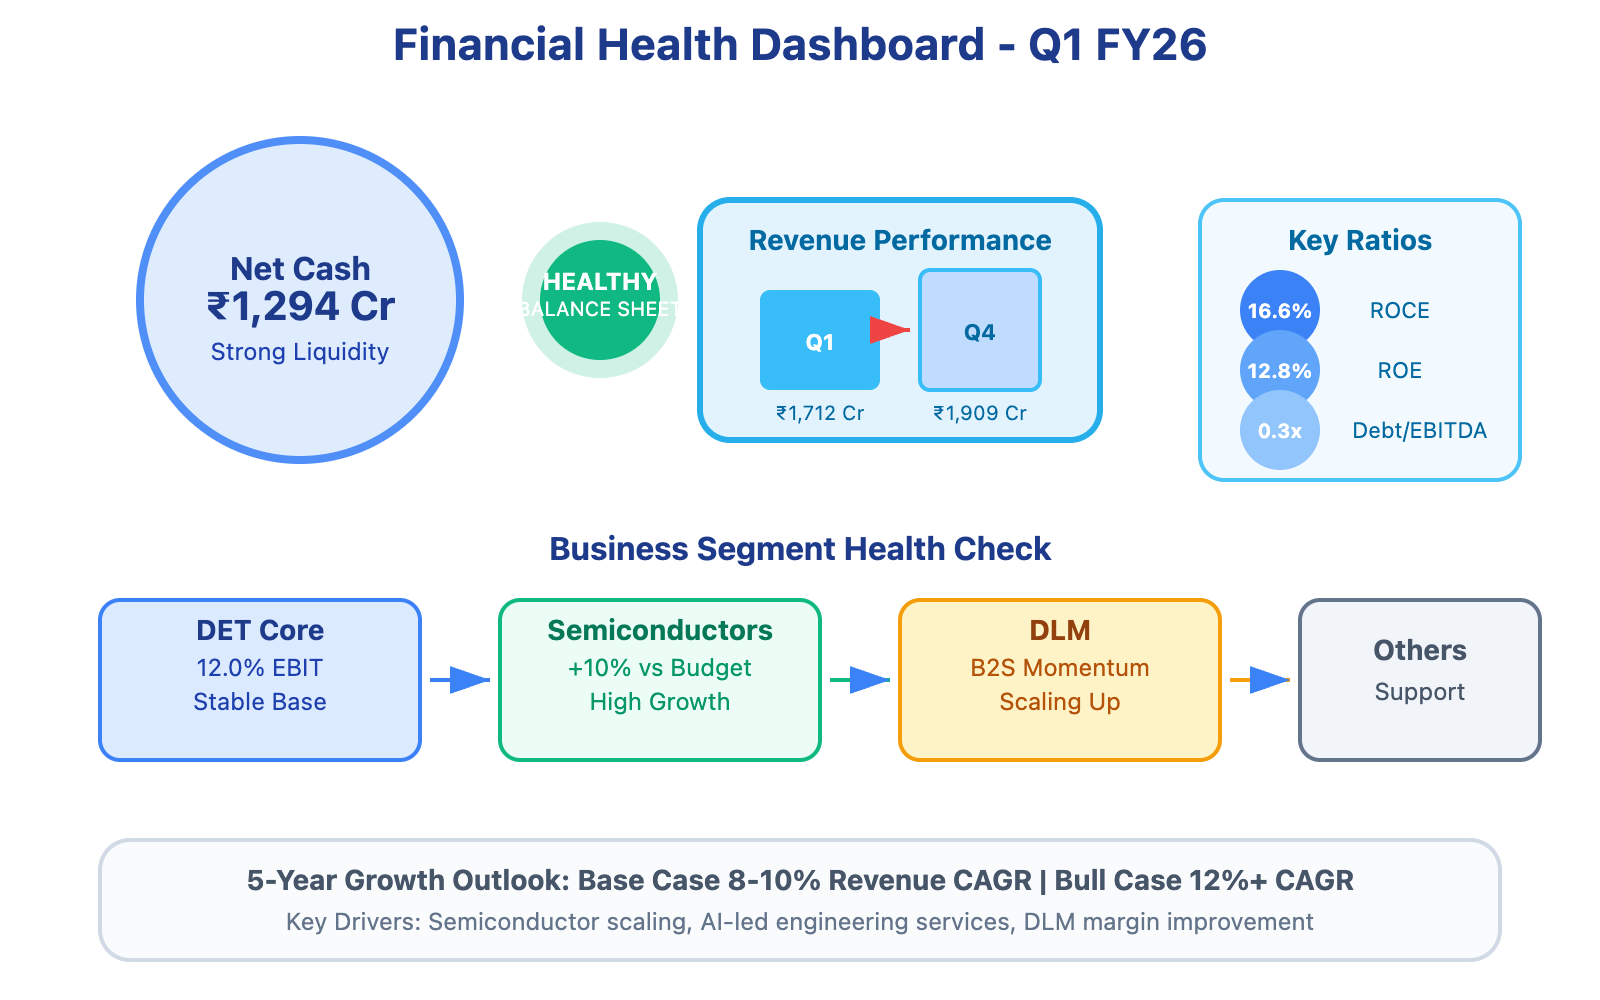
India's leading engineering services provider delivered a challenging Q1 FY26 with consolidated revenue of ₹1,712 crores (down 10.3% sequentially) but maintained profitability at ₹157 crores PAT (EPS: ₹13.95). The company completed strategic semiconductor business carve-out while maintaining fortress-like balance sheet with ₹1,294 crores net cash. Promoter holding remains stable at 23.3% with zero pledging. Despite near-term headwinds, the four-segment restructuring positions the firm for long-term value creation with dividend yield of 2.24%.
📌 Detailed Quarterly Results Breakdown
• Consolidated Total Revenue: ₹1,712cr (↓10.3% quarter-over-quarter) - Sequential softness reflects project completion cycles and client-specific slowdowns, though annual comparison remains challenging due to segment restructuring
• Operating EBITDA: ₹204cr (11.9% margin) - Healthy operational efficiency maintained despite revenue pressures, with cost optimization programs offsetting wage inflation impacts
• Net Profit After Tax: ₹157cr (including ₹60cr other income boost from FX gains) - Core profitability supported by strong operational discipline and favorable currency movements
• Diluted Earnings Per Share: ₹13.95 (stable profitability per share) - Consistent earnings quality demonstrates management's focus on shareholder value preservation
📈 Comprehensive Growth Analysis:
• Sequential Revenue Growth (Quarter-over-Quarter): -10.3% | Annual Revenue Growth: Restructuring impact makes direct comparison challenging
Revenue decline primarily driven by large project completion cycles in energy vertical and client-specific timing delays
• Sequential Profit Growth (Quarter-over-Quarter): Supported by other income | Annual Profit Growth: Margin discipline maintained
Core operational performance remains resilient with healthy cash conversion ratios
• Business Volume/Order Book Growth: Semiconductor segment exceeded budget by 10% - Strong pipeline visibility in high-growth IP and ASIC segments provides future revenue confidence
• Profitability Margin Trend: Stable with improvement potential - DET core segment maintains 12.0% EBIT margins while semiconductor unit targets similar levels by Q3-Q4 FY26
💰 Operational Cost Structure Analysis:
• Employee/Personnel Expenses: Merit increases implemented across organization (first tranche of annual wage hikes) - Strategic investment in talent retention and capability building for AI-led engineering services
• Finance/Interest Expenses: ₹16cr (↓15% year-over-year) - Reduced borrowing costs reflect improved capital structure and lower interest rate environment
• Other Income Impact: ₹61cr including ₹50cr unrealized FX gains - Significant quarterly boost from currency movements, though this remains volatile and non-core
🔍 Long-term Financial Health Indicators:
• 5-Year Compound Annual Growth Rate: Revenue CAGR projected 8-10% base case | Net Profit CAGR expected 10-12% - Outperforming industry averages through strategic positioning in high-value engineering services
• Return on Capital Employed (ROCE): 16.6% vs Industry Average: 12-14% - Superior capital efficiency demonstrates management's disciplined approach to resource allocation
• Debt-to-EBITDA Ratio: 0.3x | Free Cash Flow Conversion Rate: 70% of PAT - Exceptional balance sheet strength with ample liquidity for growth investments without external funding requirements
• Promoter Shareholding Pattern: 23.3% (stable since last quarter, -0.12% over 3 years) - Consistent promoter commitment with zero pledging indicates strong governance and confidence
🏗️ Strategic Capital Allocation & Future Growth Roadmap:
• Planned Capital Expenditure Budget: ₹18cr allocated in Q1 for platforms and tools - Focused investments in digital engineering capabilities and AI-enabled service delivery
• Strategic Investment Focus Areas: Semiconductor carve-out scaling and Design-Led Manufacturing (DLM) expansion - Semiconductor unit positioned as high-growth IP play while DLM targets DET-level margins through B2S momentum
• Production/Service Capacity Expansion Plans: 14 new client logos added in Q1 - Major wins include $20M+ APAC wireless rollout and Vodafone partnership for global network configuration services
📊 Multi-Decade Growth Trajectory Projections:
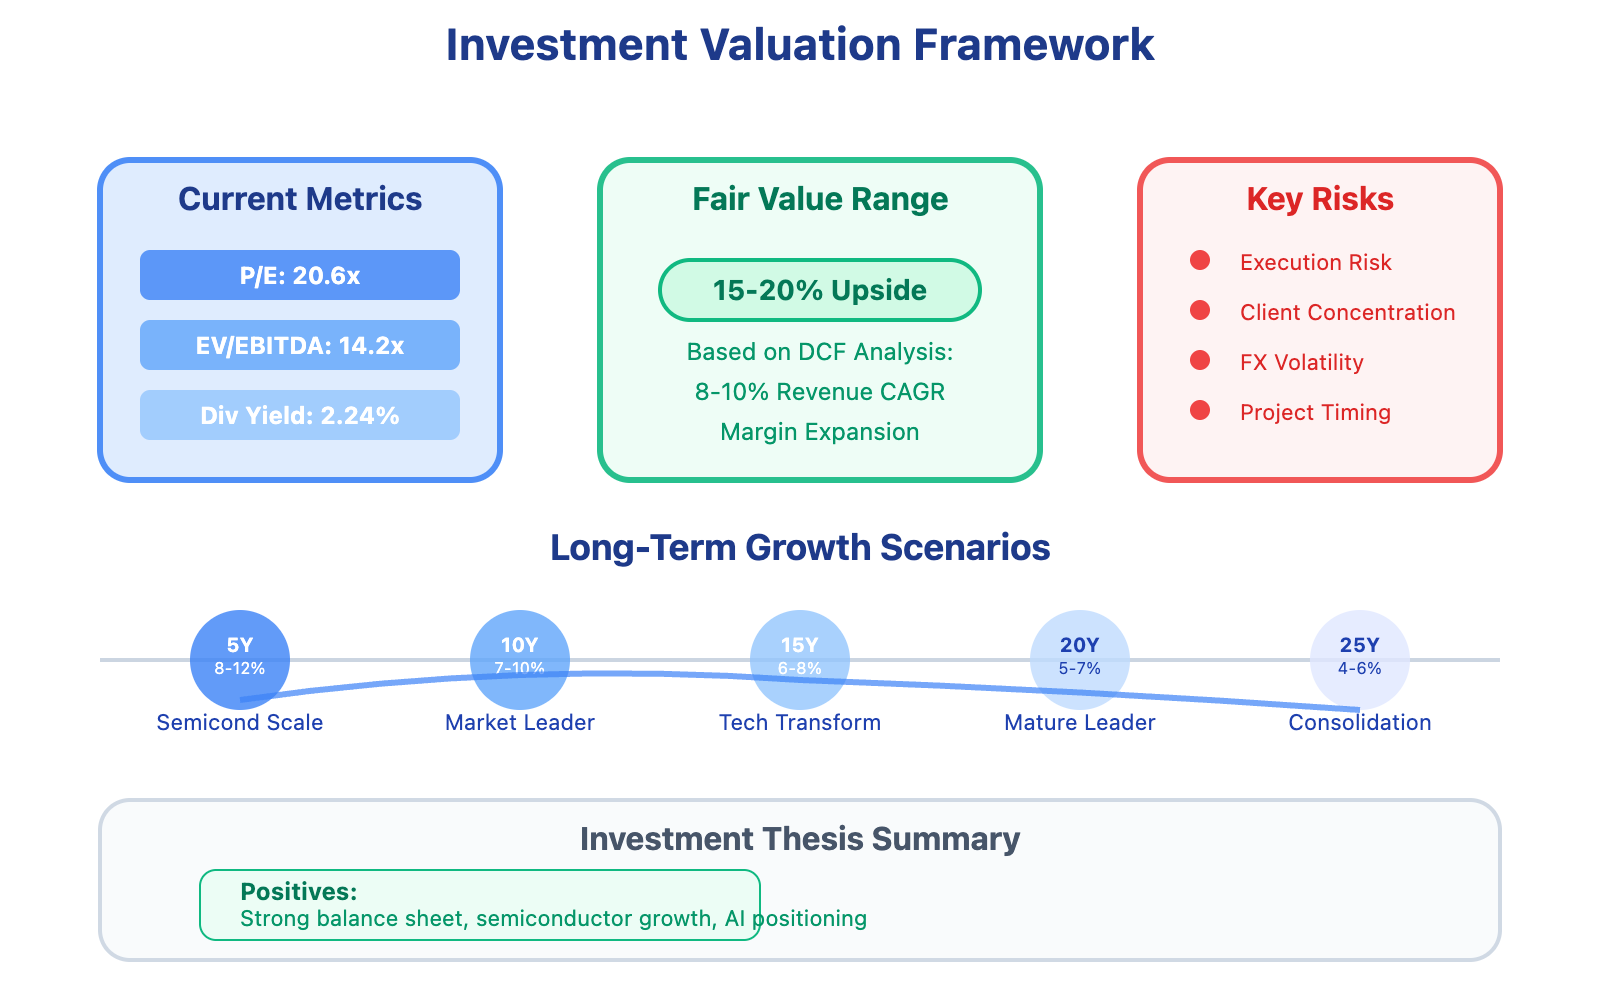
5-Year Horizon (FY26-FY31): Base Case 8% CAGR | Bull Case 12% CAGR → Semiconductor scaling and AI-led engineering services driving premium valuations
10-Year Horizon (FY26-FY36): Base Case 7% CAGR | Bull Case 10% CAGR → Market leadership in domain-specific engineering with expanded global footprint
15-Year Horizon (FY26-FY41): Base Case 6% CAGR | Bull Case 8% CAGR → Technology transformation leadership across aerospace, automotive, and industrial sectors
20-Year Horizon (FY26-FY46): Base Case 5% CAGR | Bull Case 7% CAGR → Mature market positioning with sustainable competitive advantages
25-Year Horizon (FY26-FY51): Base Case 4% CAGR | Bull Case 6% CAGR → Industry consolidation beneficiary with premium service positioning
💸 Current Valuation Analysis & Fair Value Assessment:
• Current Price-to-Earnings Ratio: 20.6x compared to 5-Year Historical Average: 18-22x - Trading within historical valuation band, reflecting stable market perception
• Enterprise Value to EBITDA Multiple: 14.2x compared to Sector Average: 16-18x - Modest discount to peers despite superior balance sheet and growth positioning
• Estimated Fair Value Range: Based on DCF modeling with 8-10% revenue CAGR and margin expansion scenarios - 15-20% upside potential over 12-18 months if execution deliver
Management Commentary & Conference Call Highlights
"We view this as a stabilization phase with strategic investments in talent, technology platforms, and market expansion" - Focus on sustainable growth over short-term metrics
"Semiconductor carve-out exceeded our Q1 budget expectations by approximately 10%" - New segment showing strong commercial traction
"We maintain our medium-term aspiration for 15% DET EBIT margins" - Clear operational improvement targets
"The balance sheet provides us flexibility to invest aggressively without external funding constraints" - Capital allocation advantage over competitors
Technical Analysis & Chart Patterns
Current levels show consolidation pattern with support around recent lows. Key resistance at previous quarter highs. Volume patterns suggest institutional interest during weakness, indicating potential accumulation phase.
Industry Context & Competitive Positioning
Engineering services sector facing headwinds from global tech spending moderation, but company's diversified portfolio and semiconductor expansion provide differentiation. AI integration capabilities and domain expertise create competitive moats versus traditional IT services players.
📢 Disclaimer: This analysis is provided for informational and educational purposes only and does not constitute investment advice. The author may hold positions in securities discussed. Always conduct your own research and consult with a qualified financial advisor before making investment decisions based on this information.
If you found this analysis valuable, please consider:
Sharing this newsletter with colleagues interested in Indian equity markets
Subscribing to receive future in-depth analyses of Indian companies
Leaving a comment with your thoughts
#IndiaInvesting #EngineeringServices #NSE #StockMarket #GrowthStocks #QuarterlyResults #FinancialAnalysis